Create User-friendly Interface with Chart.js
Tutorial from W3 Schools
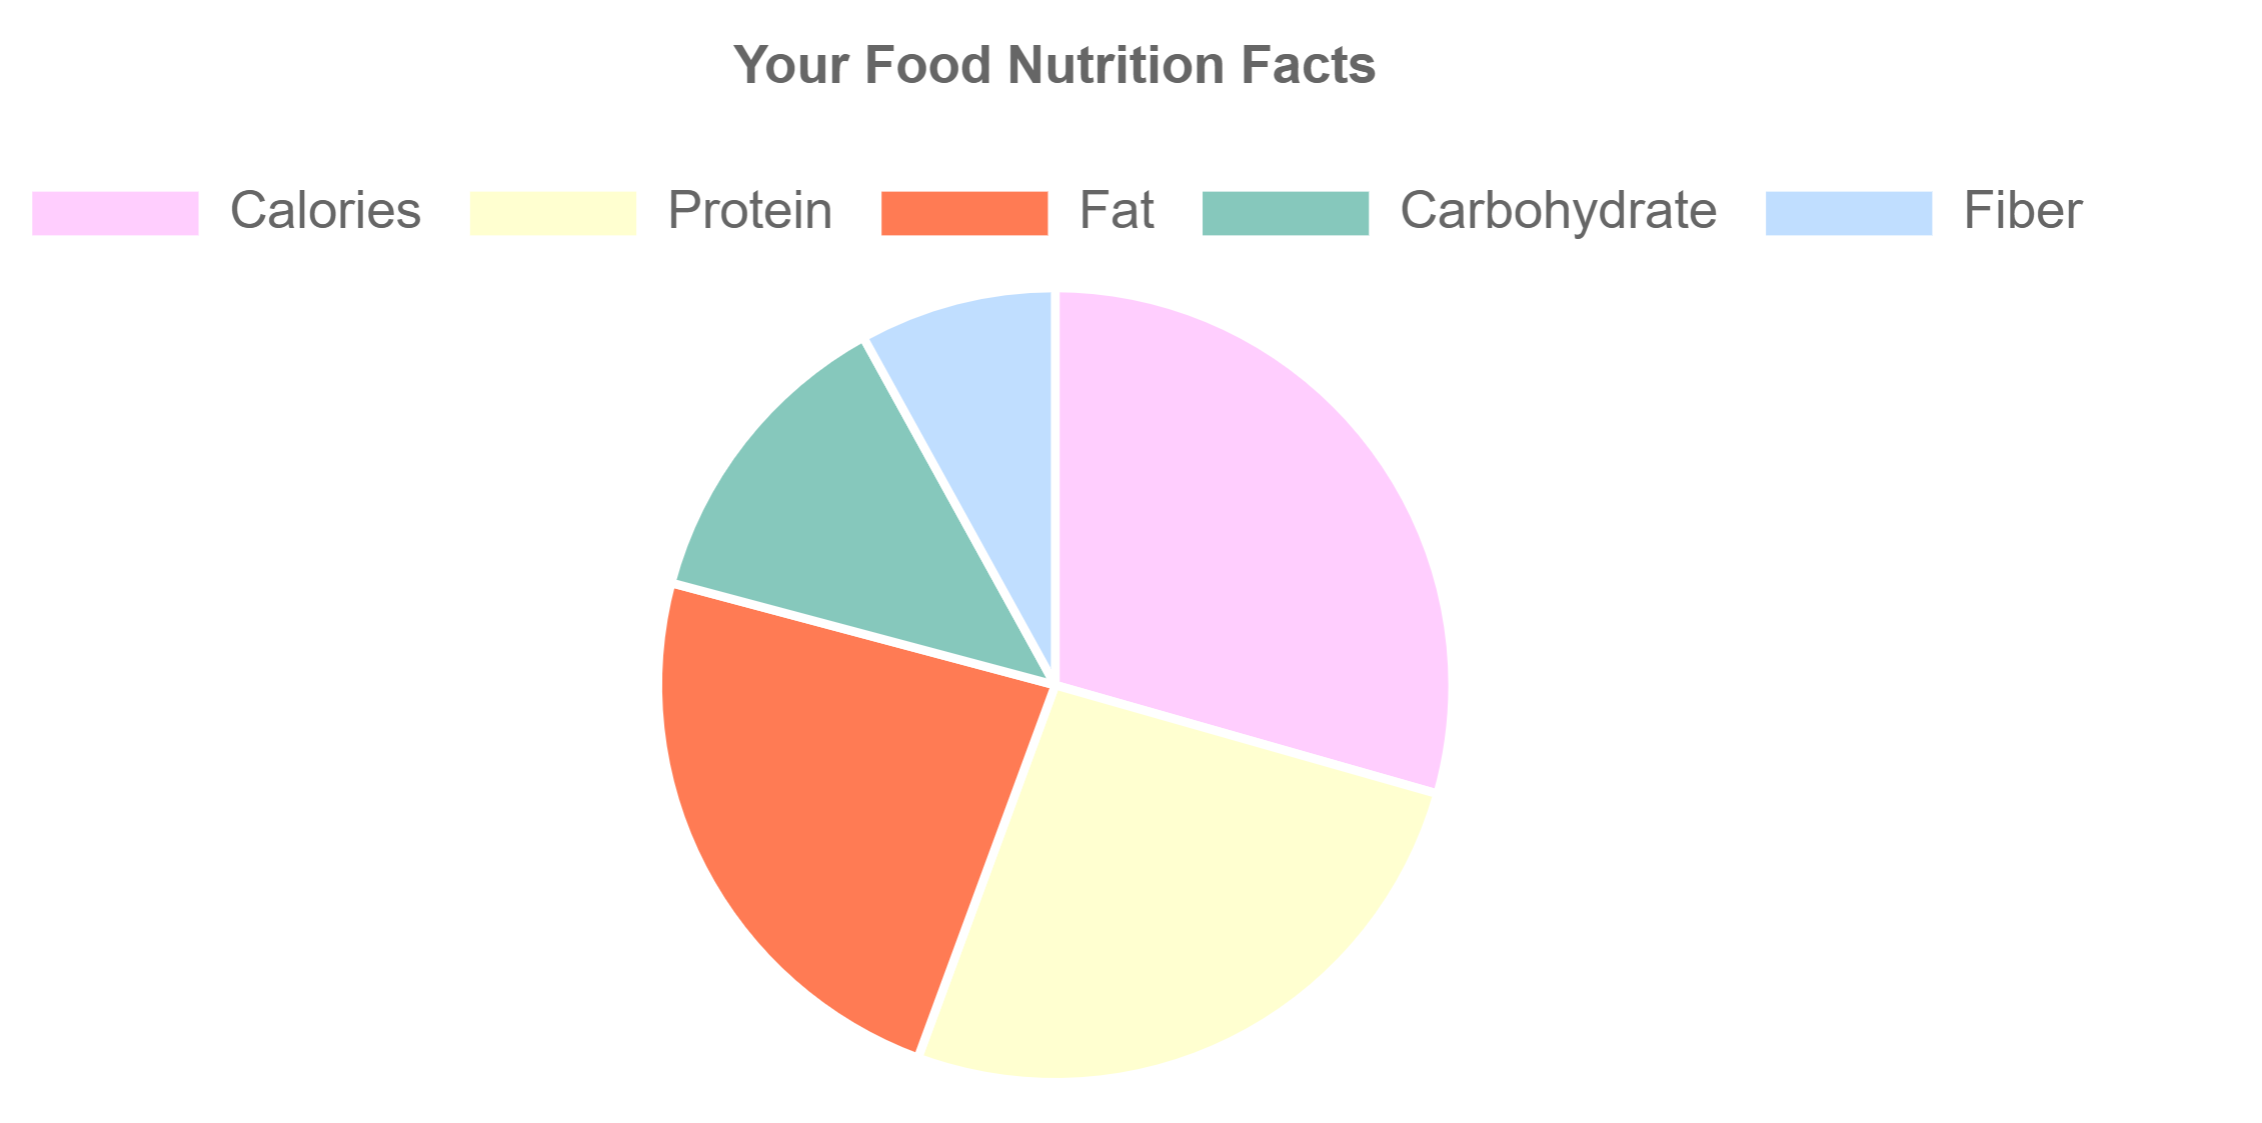
Code example of pie chart:
1
2
3
4
5
6
7
8
9
10
11
12
13
14
15
16
17
18
19
20
21
22
23
24
25
26
27
28
29
30
31
32
33
34
35
36
37
38
39
<!DOCTYPE html>
<html>

<script
src="https://cdnjs.cloudflare.com/ajax/libs/Chart.js/2.9.4/Chart.js">
</script>

<canvas id="myChart" style="width:100%;max-width:500px"></canvas>

<script>
var xValues = ["Calories", "Protein", "Fat", "Carbohydrate", "Fiber"];
var yValues = [55, 49, 44, 24, 15];
var barColors = [
  "#FFCEFE",
  "#FFFFD0",
  "#FF7B54",
  "#86C8BC",
  "#C0DEFF"
];

new Chart("myChart", {
  type: "pie",
  data: {
    labels: xValues,
    datasets: [{
      backgroundColor: barColors,
      data: yValues
    }]
  },
  options: {
    title: {
      display: true,
      text: "Your Food Nutrition Facts"
    }
  }
});
</script>

</html>

Example of Node.js setup a webserver, request DynamoDB data
index.js
1
2
3
4
5
6
7
8
9
10
11
12
13
14
15
16
17
18
19
20
21
22
23
24
25
26
27
28
29
30
31
32
33
34
35
36
37
38
39
40
41
42
43
44
45
46
47
48
49
50
51
52
53
const http = require('https');
const http_test = require('http');


const host = 'localhost';
const port = 8000;

function httpGet() {
    return new Promise(((resolve, reject) => {
        var options = {
            hostname: 'your_endpoint.execute-api.eu-central-1.amazonaws.com',
            path: '/items',
            method: 'GET'
        };

      const request = http.request(options, (response) => {
        response.setEncoding('utf8');
        let returnData = '';

        response.on('data', (chunk) => {
          returnData += chunk;
        });

        response.on('end', () => {
          resolve(JSON.parse(returnData));
        });

        response.on('error', (error) => {
          reject(error);
        });
      });
      request.end();
    }));
  }


var scale_response = async function getVoiScale() {
    const response = await httpGet();
    console.log(response);
}

const requestListener = function (req, res) {
    scale_response();

    res.writeHead(200);
    res.end("My first server!");
};


const server = http_test.createServer(requestListener);
server.listen(port, host, () => {
    console.log(`Server is running on http://${host}:${port}`);
});
Example of side-by-side chart display
styles.css
1
2
3
4
5
6
7
8
9
10
11
12
13
14
15
16
17
18
19
20
21
22
23
24
25
26
27
28
29
30
31
32
33
34
35
*{
    margin: 0;
    padding: 0;
    font-family: sans-serif;
}

.charMenu {
    width: 100vw;
    height: 40px;
    background: #60b5b2;
    color: rgb(242, 14, 14);
}

.chartMenu  p {
    padding: 10px;
    font-size: 20px;
}

.chartCard {
    width: 100vw;
    height: calc(100vh - 40px);
    background: rgba(103, 182, 179, 0.2);
    display: flex;
    align-items: center;
    justify-content: center;
}

.chartBox {
    width: 300px;

    padding: 20px;
    border-radius: 20px;
    margin: 20px;
    background: rgb(168, 217, 180);
}
index.html
1
2
3
4
5
6
7
8
9
10
11
12
13
14
15
16
17
18
19
20
21
22
23
24
25
26
27
28
29
30
31
32
33
34
35
36
37
38
39
40
41
42
43
44
45
46
47
48
49
50
51
52
53
54
55
56
57
58
59
60
61
62
63
64
65
66
67
68
69
70
71
72
73
74
75
76
77
78
79
80
81
82
83
84
85
86
87
88
89
90
91
92
93
94
95
96
97
98
99
100
101
102
103
104
105
106
107
108
109
110
111
112
113
114
115
116
117
118
119
120
<!DOCTYPE html>
<html>

<head>

<meta charset="utf-8">
<meta name="viewport" content="width=device-width, initial-scale=1">

<link rel="stylesheet" href="styles.css">
<! -- this is for pie chart -->

</head>


<body>
	<div class="charMenu">
		<p style="text-align:center;line-height:35px;font-family:verdana">VoiScale - We care about your heath!</p>
	</div>

	<div class="chartCard">
		<div class="chartBox">
			<canvas id="myChart"></canvas>
		</div>


		<div class="chartBox">
			<canvas id="hisChart"></canvas>
		</div>
	</div>


  	<script src="https://cdn.jsdelivr.net/npm/chart.js"></script>

  	<script>
		const ctx = document.getElementById('myChart');

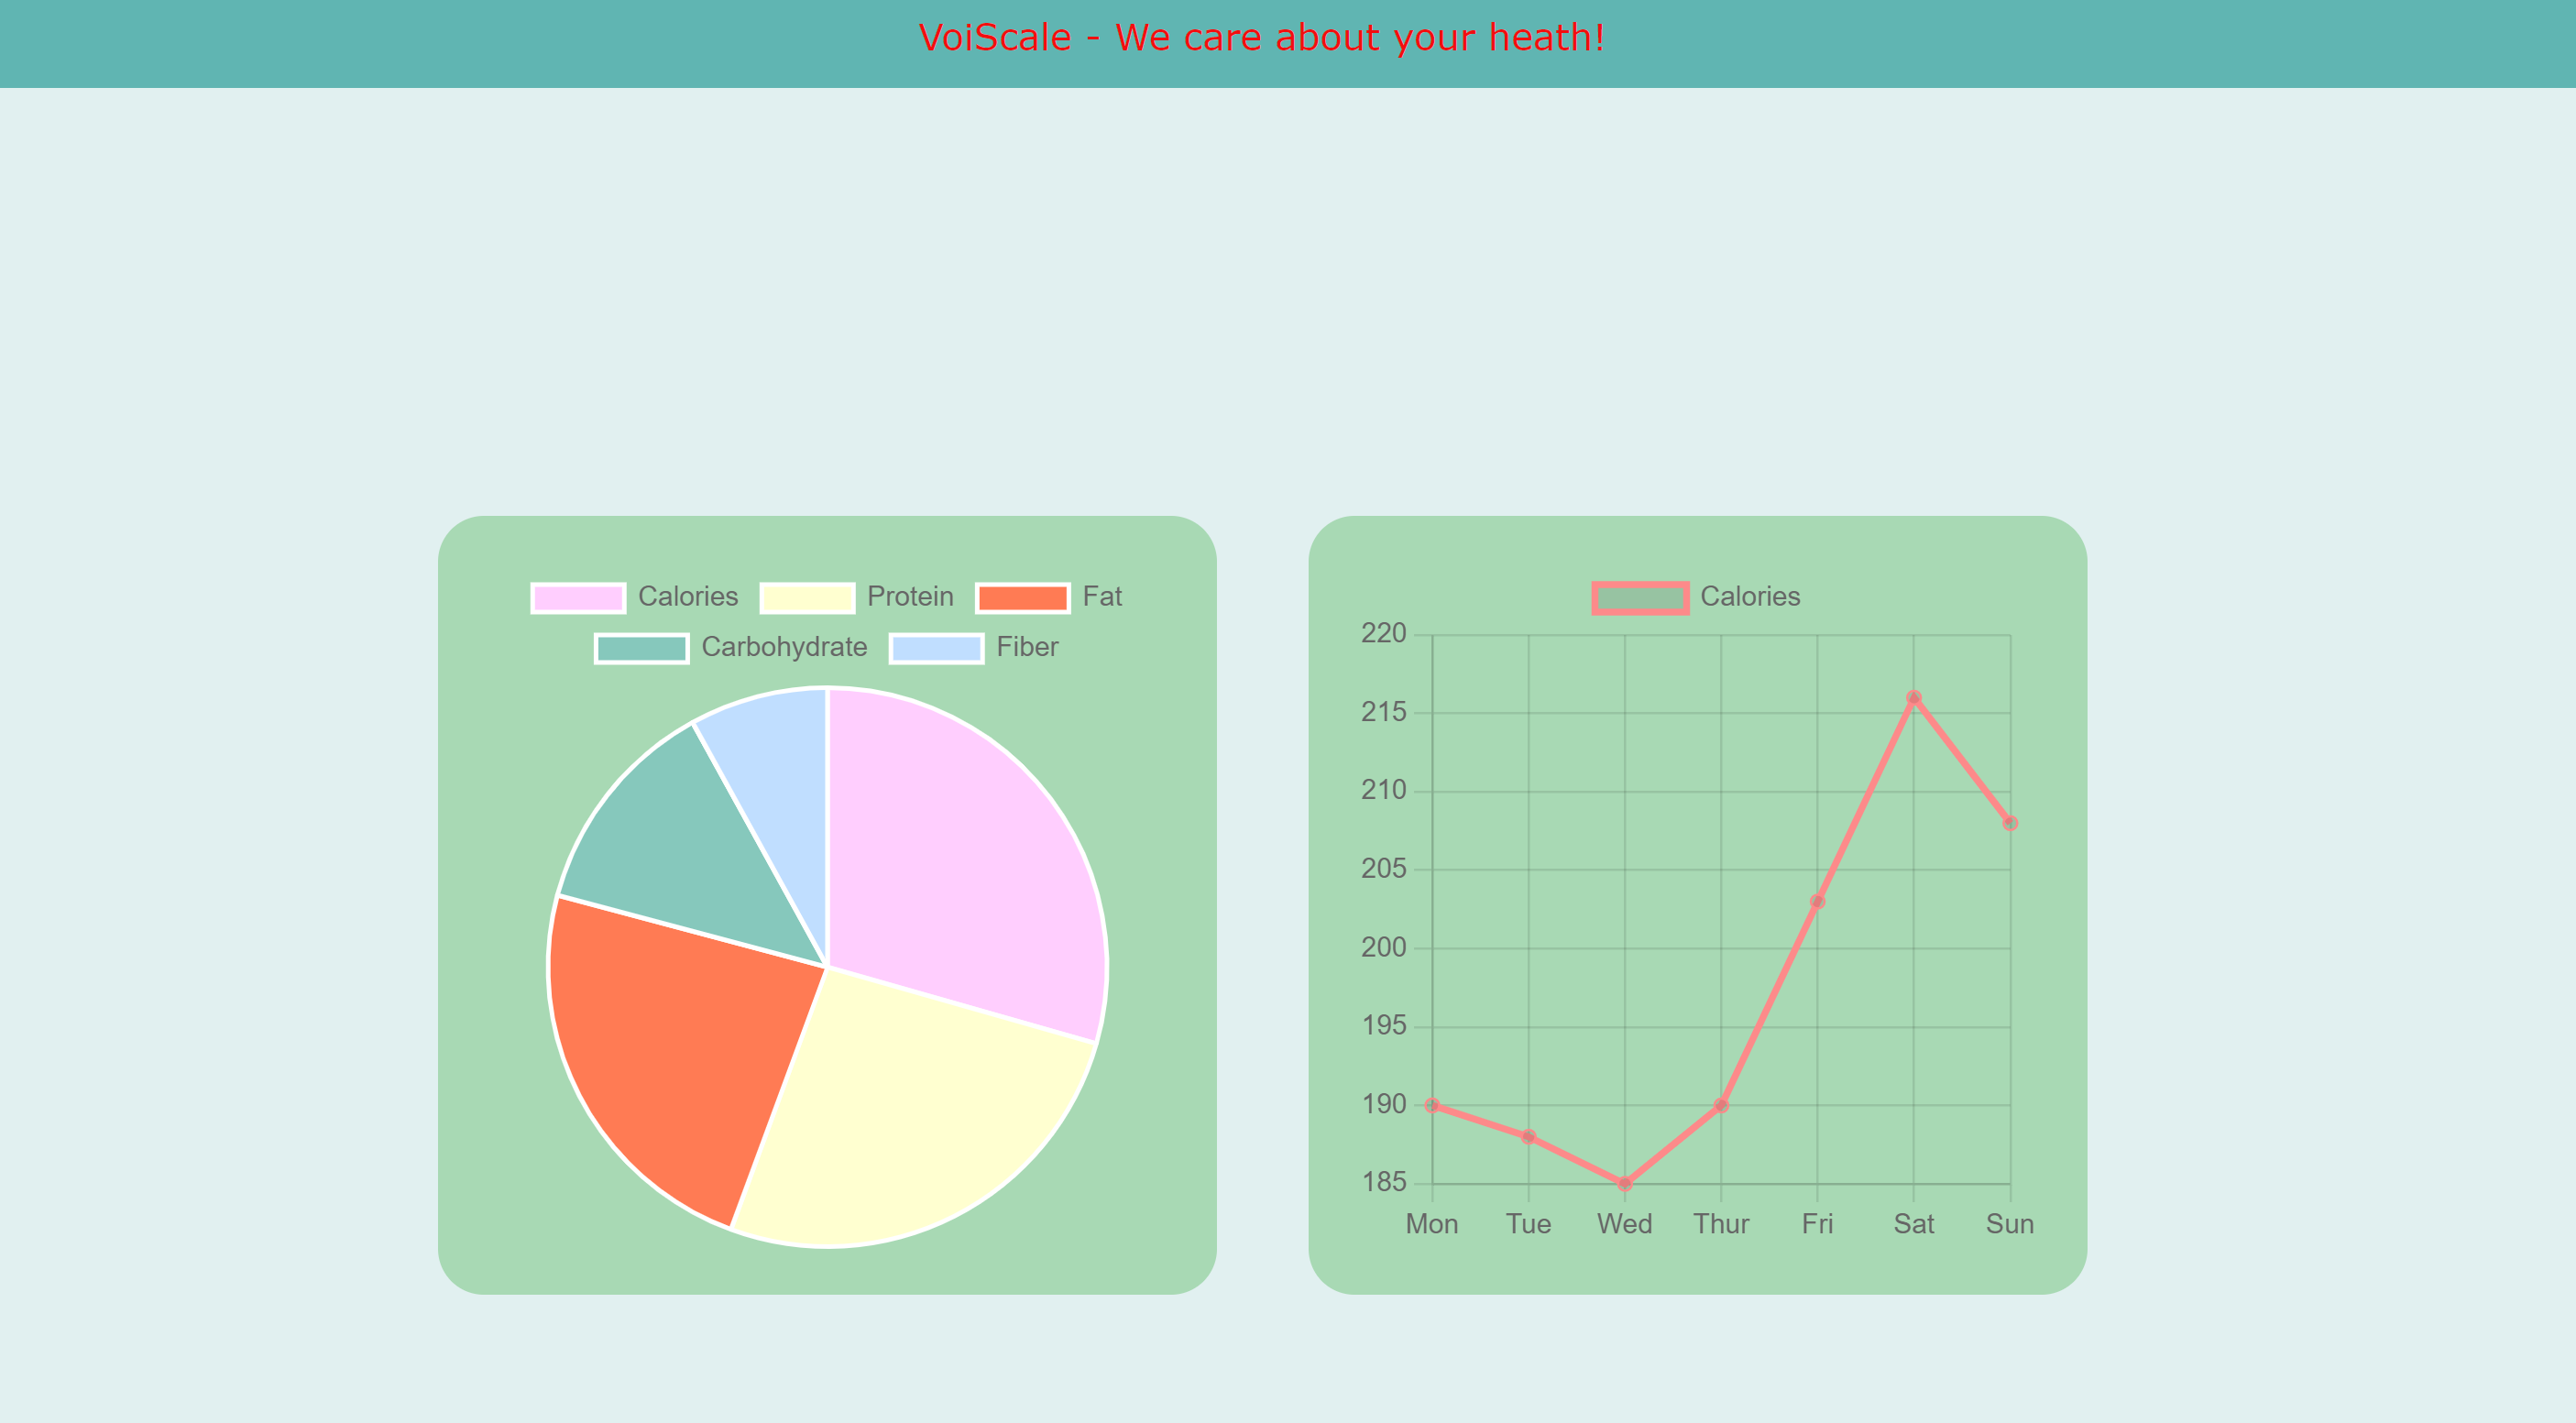
		var xValues = ["Calories", "Protein", "Fat", "Carbohydrate", "Fiber"];
		var yValues = [55, 49, 44, 24, 15];
		var barColors = [
			"#FFCEFE",
			"#FFFFD0",
			"#FF7B54",
			"#86C8BC",
			"#C0DEFF"
		];

		new Chart("myChart", {
			type: "pie",
			data: {
				labels: xValues,
				datasets: [{
					backgroundColor: barColors,
					data: yValues
				}]
			},
			options: {
				title: {
					display: true,
					text: "Your Food Nutrition Facts"
				}
			}
		});
 	</script>


    <script>
		const cty = document.getElementById('yourChart');

		new Chart(cty, {
			type: 'bar',
			data: {
				labels: ['Red', 'Blue', 'Yellow', 'Green', 'Purple', 'Orange'],
				datasets: [{
					label: '# of Votes',
					data: [12, 19, 3, 5, 2, 3],
					borderWidth: 1
				}]
			},
			options: {
				aspectRatio: 1,
				scales: {
					y: {
						beginAtZero: true
					}
				}
			}
		});
  	</script>


	<script>
		const ctz = document.getElementById('hisChart');

		new Chart(ctz, {
			type: 'line',
			data: {
				labels: ['Mon','Tue','Wed','Thur','Fri','Sat','Sun'],
				datasets: [
					{
						data: [190,188,185,190,203,216,208],
						label: "Calories",
						borderColor: "#FD8A8A",
						fill: false
					}
				]
			},
			options: {
				aspectRatio: 1,
				title: {
					display: true,
					text: 'Calories consumption'
				}
			}
		});
	</script>

</body>


</html>

